Mortgage Blog
Let us make this easy for you!
Weekly Update September 29th 2023
October 6, 2023 | Posted by: Paul London
Real Estate News in Brief
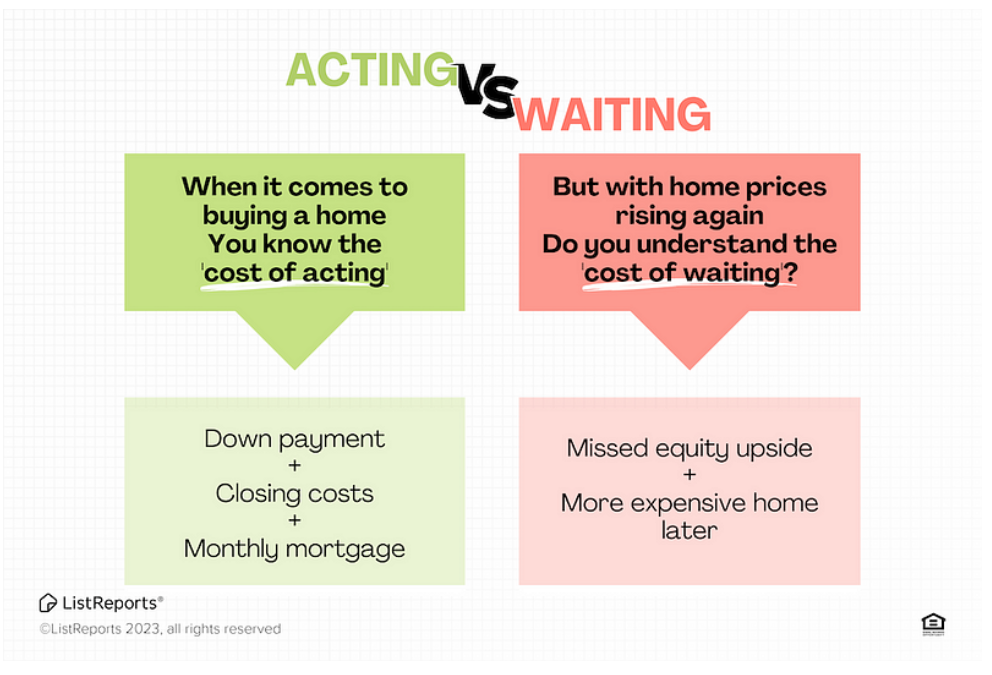
For would-be homebuyers, last week was a 1–2 punch of record home prices (Case-Shiller index) and a 23-year high for mortgage rates (average 7.65% on a 30-yr mortgage). In this environment, your clients know the cost of acting, but do they fully understand the cost of waiting?
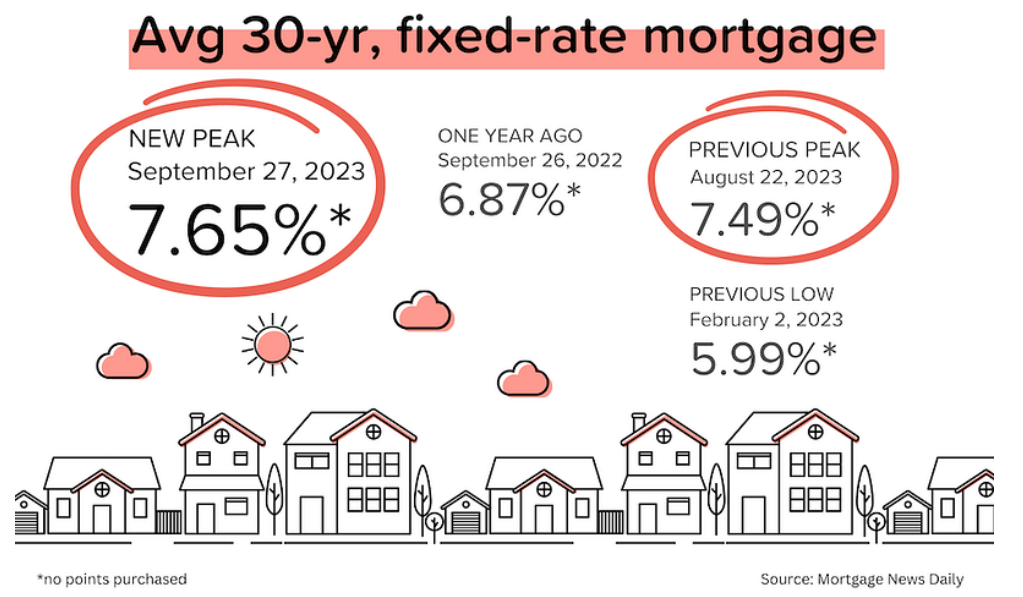
Average 30-yr mortgage rates just set another new, two-decade high: 7.65%. Yields have been rising across the globe in response to ‘higher for longer’ commentary from central bankers. In addition, the Brent crude oil price is approaching $100/barrel, causing concerns about a rebound in inflation. [Mortgage News Daily]
August new home sales fell 8.7% MoM to an annualized pace of 675,000 units. That’s the lowest figure we’ve seen since March 2023. Even with the rate buydowns and other incentives that builders are offering, spiking mortgage rates are clearly dampening demand. [Census Bureau]
The pending home sales index for August dropped 7.1% MoM to 71.8. That was much worse than expectations, and suggests that existing home sales for September will come out between 3.7–3.9 million units. [NAR]
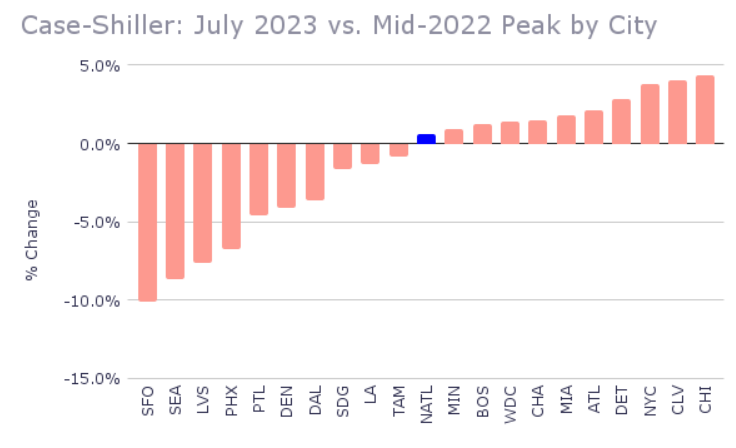
Ok, how about some good news (for homeowners anyway)? The Case-Shiller national home price index for July rose 0.6% MoM and hit a new all-time high. The modest decrease in prices that we saw in 2H 2022 has already been erased. 10 out of 20 big city indexes are also at new highs, and some of the hardest-hit west coast cities are seeing prices rebound quickly. [S&P Global]
A similar story from the FHFA index, which rose 0.8% MoM in July (the 6th-straight increase). Price growth for full-year 2023 is now annualizing at 7%! Prices in the Mid-Atlantic and Midwest continue to rise rapidly. [FHFA]
The nationwide office vacancy rate just hit an all-time high of 13.3%. (And it’s much higher in cities like San Francisco). With new space still being delivered, workers still loving WFH, and refinancings looming, office landlords are under pressure. [NAR]
Pending sales presage 3.7–3.9 million in existing home sales
I had a feeling that August pending sales would be bad. But they turned out much worse, falling 7.1% MoM and 18.7% YoY to 71.8. Even during the extra frigid (for transactions) winter of 2022, the pending sales number didn’t get this low. In April 2020 (when the onset of COVID convulsed the real estate market), the pending sales figure was 70 — just a shade lower than this month!
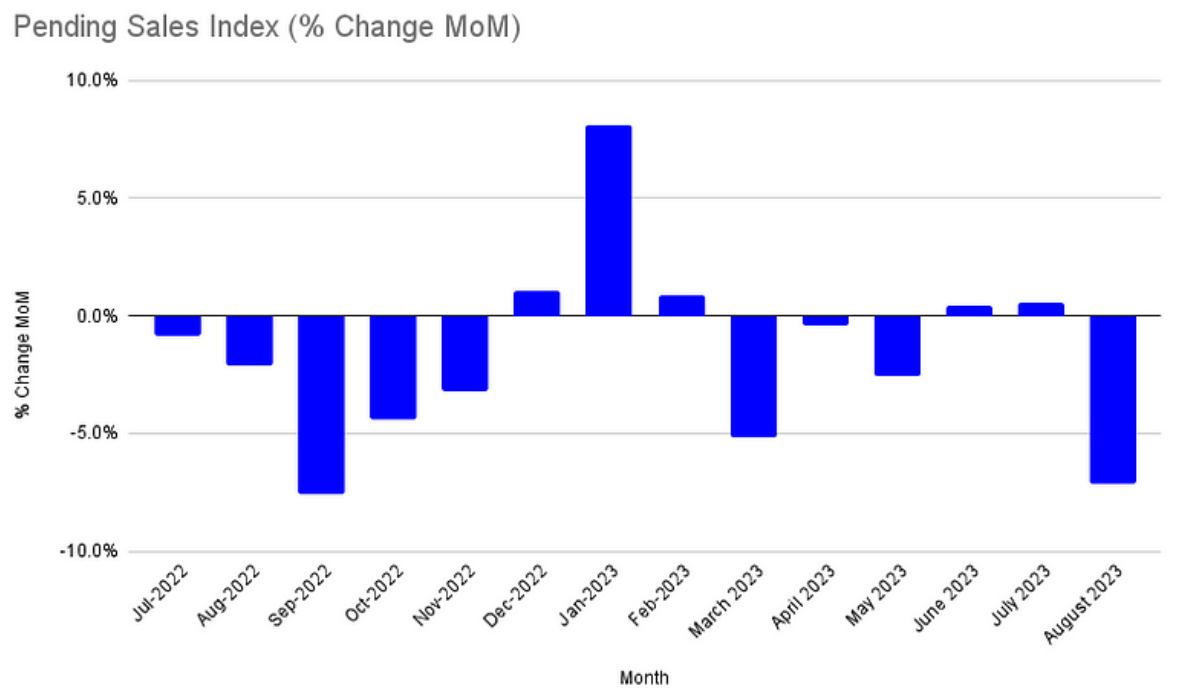
Q: OK, I get it. Pending sales were bad, but what does 71.8 mean in the real world?
A: An index level of 100 is comparable to 2001 activity levels, when monthly existing home sales were running at 5.0–5.5 million units annualized. So we’re running about 28% BELOW 2001 activity levels. I’d estimate that existing home sales for September will end up somewhere between 3.7 and 3.9 million units. Not good.
* Here’s a little trick: take the pending sales index number and multiply it by 52,000–55,000. That’s a pretty solid estimate of what annualized existing home sales will be next month. If there is reason to expect a higher % of cancellations, use 52,000; in more normal conditions use 54,000 or 55,000. So 71.8 X 52,000 = 3,734,0000 in predicted monthly existing sales at the low end.
Acting vs. Waiting
I’ve been seeing more news stories about ‘renting being cheaper than buying’. And also several surveys showing that a large percentage of would-be buyers are just waiting for prices or mortgage rates to come down. I understand their pain: affordability has been crushed by record home prices and mortgage rates spiking to two-decade highs.
- But here’s the problem with waiting to buy (continuing to rent) when home prices are rising:
According to Case-Shiller, national home prices rose nearly 6% in 2022. And based on the price growth we’ve seen during the first 7 months of 2023, we’re on pace for another 5% appreciation this year.
If you had bought a home for $400,000 at the beginning of 2022, that home would now be worth approximately $445,000 (6% + 5% = 11% increase).
In other words, you would have created $45,000 in equity value in just two years. This is a really big number.
Let’s say you had put 10% down ($40,000). Your return on equity would already be >100% because you borrowed most of the purchase price, but the upside is all yours!
On the other hand, let’s say that at the beginning of 2022 you decided to wait. But frustrated with watching home prices keep rising, you finally bit the bullet and bought a similar home at the end of 2023.
You’re now paying $445,000 for the home, and putting $44,500 down (10%). And you’ve missed all that equity upside. And your landlord probably raised the rent at some point.
-
Take a look at any long-term (40+ years) chart of home prices. They have a strong tendency to rise. Not every year, of course. But if you hold onto a property for 5–10 years, the probability that you lose money over that period is very low.
One more thing I want to point out. Most rent vs. buy analysis is very simple, comparing monthly mortgage payments to monthly rent. That’s too simple to be useful. Buying a home has significant entry and ongoing costs that renters won’t face. But homebuyers get appreciation (see example above), amortization (the principal payment they make monthly lifts their equity value), and tax benefits (mortgage interest tax deductibility, large capital gains tax exclusions).
On the Case (Shiller) Again
The Case-Shiller national home price index hit a new, all-time high in July 2023. That’s big news, because it means that the modest (3%) price decline experienced in 2H 2022 has already been eliminated. Here are some other observations from the data:
- The national price index has risen (month-over-month) for six straight months.
- 10 of the individual big city indices are also at all-time highs. Chicago and Cleveland are already 4% above their mid-2022 peaks. Tampa Bay, Los Angeles and Dallas are probably 1–2 months away from setting new records.
- San Francisco (-10%), Seattle (-9%), Las Vegas (-8%), and Phoenix (-7%), are still well below their mid-2022 peaks, but Seattle and Phoenix are rebounding quickly.
- The national price index is up 43% since December 2019 (pre-COVID). Miami and Tampa Bay are both up 67%; and Atlanta, Charlotte, Phoenix and San Diego are all up more than 50%.
-
Reminder: The reason we pay so much attention to the Case-Shiller index is that it provides the most accurate measure of home price appreciation. By tracking large numbers of transaction pairs (e.g., House A sold in October 2017 at $300,000 and again in January 2024 at $550,000), the Case-Shiller index comes closest to measuring ‘true’ appreciation. Many of the other home price measures are skewed by the mix (high-end vs. low-end etc.) of properties being sold during the period.
Mortgage Market
Just one month after setting a new, two-decade high of 7.49% on August 22, average 30-year mortgage rates shot up to 7.65% on September 27. Since the Fed’s “2nd pause” on September 20, 30-year mortgage rates have risen more than 30 bps. Huh? The Fed DOESN’T hike rates, and mortgage rates still go up?
Yup. This is a painful reminder that the market, not the Fed, ultimately sets MBS and mortgage rates. And the market has been spooked by ‘higher for longer’ commentary from Powell, other Fed members and global central bankers. Earlier this week, Minneapolis Federal Reserve President Neel Kashkari said that he worried that interest rates may need to go “meaningfully higher” to fully quell inflation.
“The two sectors of the economy that are traditionally the most sensitive to interest rate hikes, autos and housing, have both added some signs of bottoming and in some cases are starting to show some recovery that makes me cautious that we might not be as restrictive as we otherwise would think.”
I’m not sure what ‘recovery’ he’s talking about. Existing home sales are running at 2008–2010 levels. And yes, home prices are rising, but that’s mainly because supply is so tight. And why is supply so tight? Because the Fed kept rates so low, for so long, that virtually everybody got or refinanced into a very low mortgage rate. No would-be homeseller wants to exchange a 3.25% 15-year mortgage for a 7.65% 30-year!
They Said It
“On a year-to-date basis, the National Composite has risen 5.3%, which is well above the median full calendar year increase in more than 35 years of data. Although the market’s gains could be truncated by increases in mortgage rates or by general economic weakness, the breadth and strength of this month’s report are consistent with an optimistic view of future results.” — Craig Lazarra, Managing Director at S&P DJI
“Mortgage rates have been rising above 7% since August, which has diminished the pool of home buyers. Some would-be home buyers are taking a pause and readjusting their expectations about the location and type of home to better fit their budgets. It’s clear that increased housing inventory and better interest rates are essential to revive the housing market” — Lawrence Yun, NAR’s Chief Economist
 Goodbye Paperwork.
Hello Quick Approval.
Save Your Time & Apply Online. Guaranteed Lowest Rates!
