Mortgage Blog
Let us make this easy for you!
Weekly Update October 20th
October 20, 2023 | Posted by: Paul London
Real Estate News in Brief
Responding to very strong retail sales figures, the bond market took another dive, and average 30-year mortgage rates consequently moved above 8%. The slowdown in transaction volumes will likely continue, but there are signs that home prices are beginning to drift lower.
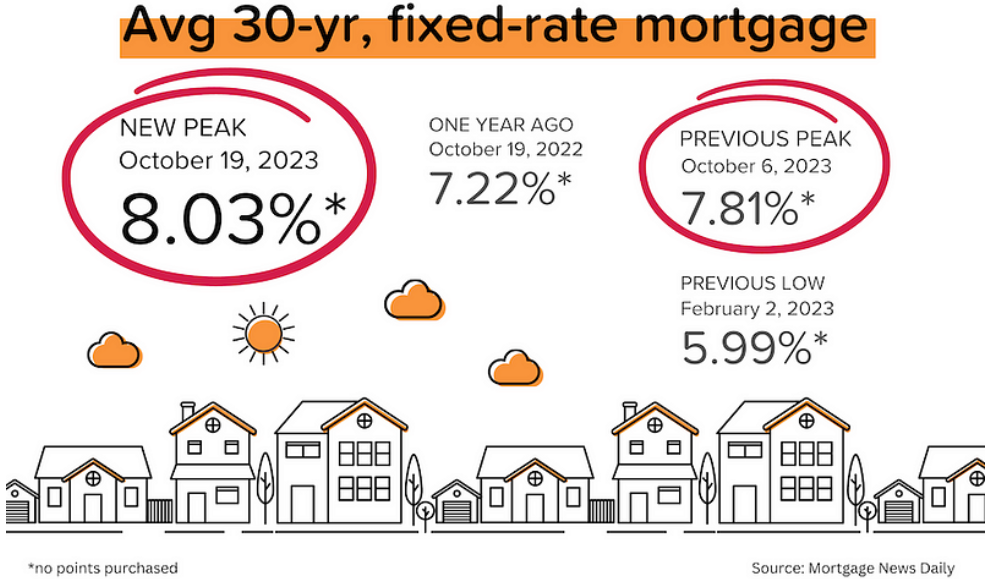
8.03%. That was the average rate for 30-year, fixed rate mortgages on October 19, according to Mortgage News Daily. As a reminder, on February 2, 2023, the average rate was 5.99%. What drove the latest spike? Read on.
Shop, shop, until we drop? September retail sales rose an incredible 0.7% MoM, trouncing expectations of a 0.3% MoM rise. The Fed wants lower inflation and slower growth. This looks like the opposite, stoking bond market fears of ‘higher for longer’ interest rates. The yield on the 10-year US treasury recently closed at 4.97%, the highest level since mid-2007. [Census Bureau]
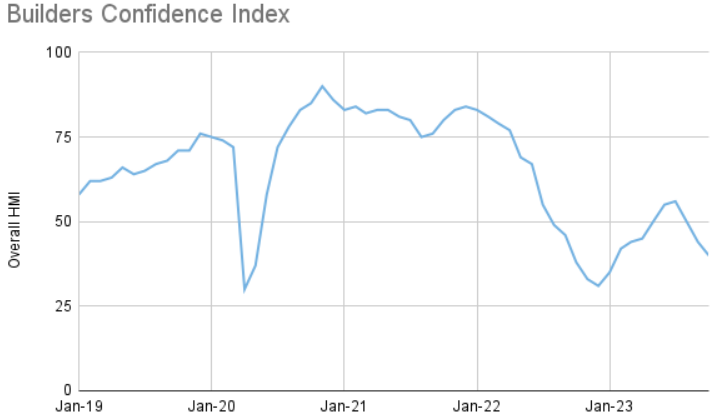
Builder confidence got hammered. The National Association of Homebuilders’ confidence index dropped 4 points to 40 in October 2023...anything under 50 is bearish. That’s the lowest figure since January 2023. “Builders have reported lower levels of buyer traffic, as some buyers, particularly younger ones, are priced out of the market by higher rates.” [NAHB]
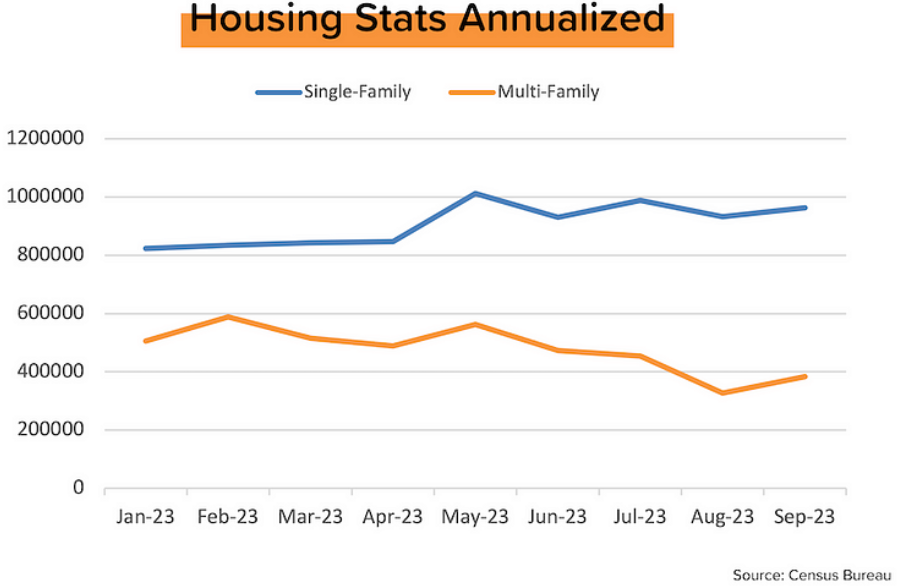
A mixed bag from housing starts & permits. New housing permits fell 4% MoM to an annualized rate of 1.47 million units. But within that, new permits for single-family homes rose 2% MoM. In fact, SFH permits have risen every month this year and now represent two-thirds of the total. [Census Bureau]
The boom in new multifamily construction (buildings with >5 units) in 2021–2022 is drawing to a close. While there are nearly 1 million MF units (on an annualized basis) under construction, permits for new MF units have plunged since the beginning of the year. [Census Bureau]
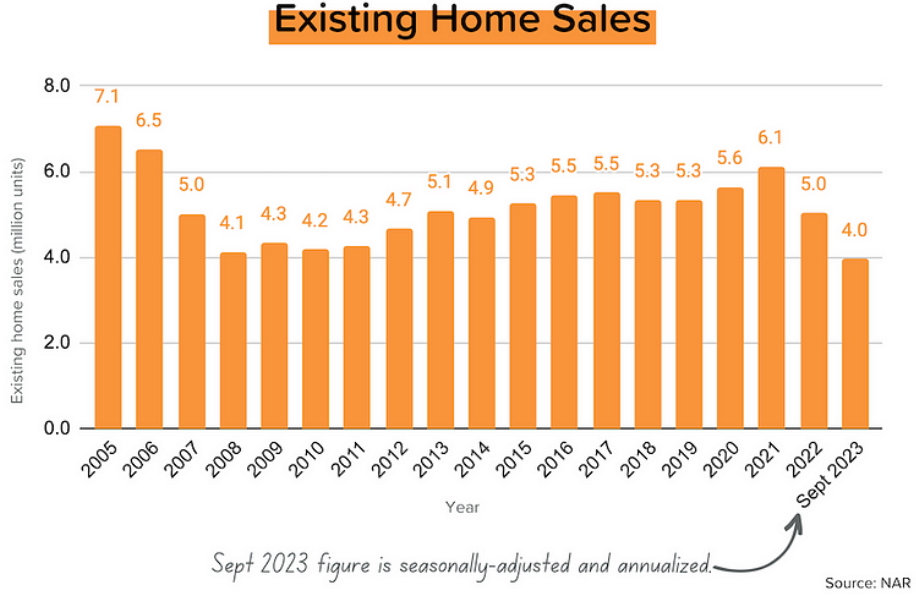
In the threes. Existing home sales for September dropped 2% MoM (and 15% YoY) to an annualized pace of 3.96 million units sold. That’s the lowest figure in 13 years, but I actually thought it would be much worse considering the movement in mortgage rates. Median home prices also dropped into the threes, in this case $394,300 (-3% MoM). [NAR]
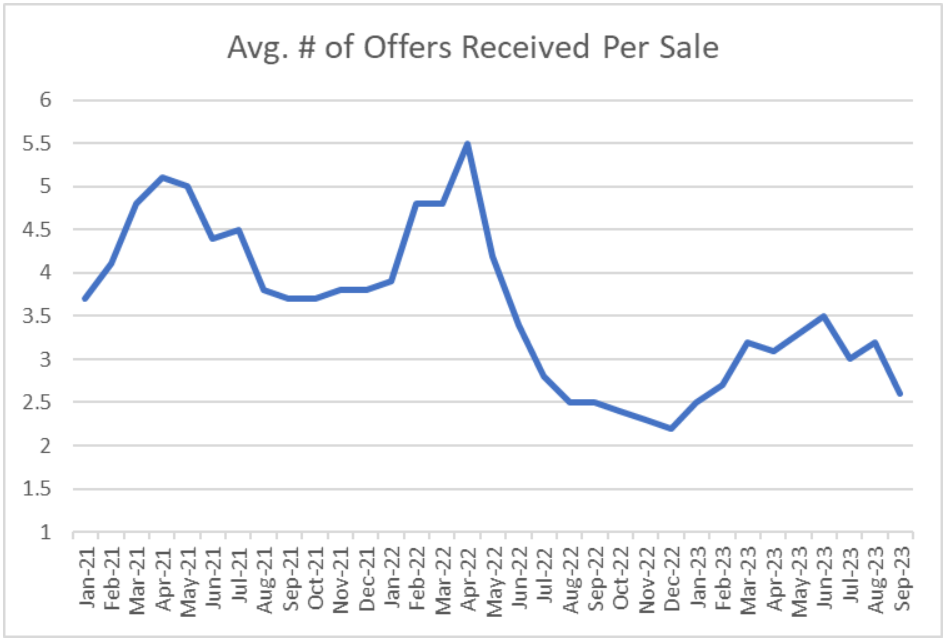
Realtors are losing confidence, but homes are still selling quickly. Only 8% of Realtors thought that buyer traffic would improve in the coming 3 months. But for the homes that sold in September, 69% were on the market less than a month, and they saw an average 2.6 offers. [NAR]
Powell in NYC. Did Fed Chairman Jerome Powell hear the pleas of the NAR, NAHB, and MBA, and explicitly call time on interest rate hikes at his Economic Club of New York speech? Of course he did not. Instead, the much-anticipated speech turned into a non-event.
A Seasonal Reminder
’Tis the season when inventory levels rise and prices fall, but people often forget that. It’s a supply and demand thing, driven by weather and school start dates. I mean, who wants to move their family in January? Yank the kids out of school mid-year and get frostbite while loading the U-haul? Also, in winter some sellers may delist their home or cut prices to move ‘stale’ inventory.
Of course, this normal seasonal pattern can get disrupted, which is what happened during the pandemic. But the underlying seasonality is still there. It’s just hidden.
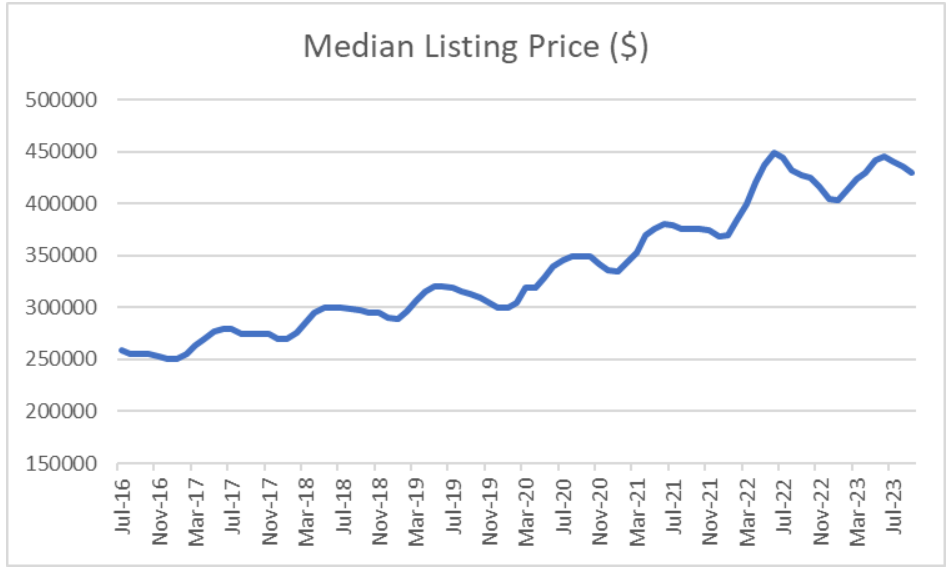
First, let’s look at the chart of median listing prices below. It’s from Realtor.com’s residential real estate database. Here’s what’s important to know:
- Listing prices trend strongly upward, but exhibit clear seasonality
- Listing prices bottom in January (occasionally December)
- Listing prices tend to peak in June or July (occasionally August)
- The average tough-to-peak rise is 12% (if you exclude 2022, which was +22%)
- The average peak-to-trough decline is 4% (if you exclude 2022, which was -10%)
- The median list price has risen 66% since July 2016
Next, let’s look at active inventory. This is also from Realtor.com and excludes listings that have already gone pending. As you can see in the graph below, the normal seasonality got completely swamped by the pandemic boom in demand. In 2020, the typical rebound in inventory basically didn’t happen at all. Here’s what you need to know:
- Active inventory has been trending lower over time, and exhibits clear seasonality
- Active inventory levels tend to trough in January or February (which is also when prices start to rise — see the connection?)
- Active inventory levels tend to peak sometime between July-September, at least until the pandemic threw everything off.
- The average trough-to-peak increase in active inventory pre-pandemic was 18%.
- The average peak-to-trough decline in active inventory pre-pandemic was 21%
- Between the peak of July 2019 and the trough of February 2022, active inventory fell 72%.
- Active inventory has dropped by 52% between July 2016 and today.
I’ll be watching this inventory figure very closely. If it keeps rising in October and November, that will be because there is a ‘buyer’s strike,’ and prices could begin falling again.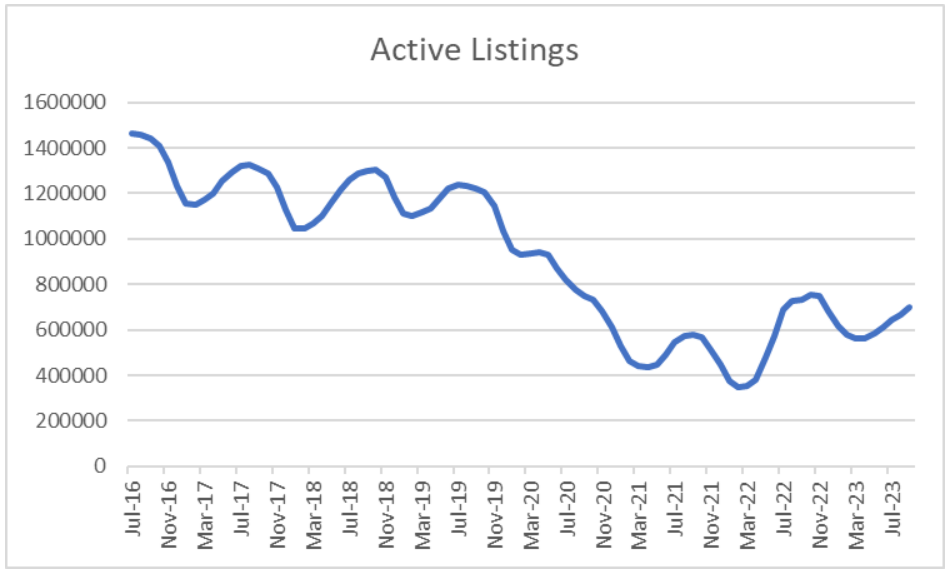
Realtor’s Confidence Index for September
I love this report because it goes beyond just sales and inventory numbers. The results of the September survey were consistent with low (and slowing) transaction activity, and with relatively high (but easing) competitive intensity for the limited supply.
- Only 8% of respondents said that they expect buyer activity to pick up over the next 3 months. But that’s not terribly surprising given normal seasonality and current mortgage rates.
- The number of offers per home sold in September dropped to 2.6 (from 3.2 in August). This means that on average, there were 1.6 unsuccessful offers for each home sold (because 1 offer actually got it).
- 26% of the homes sold in September transacted above their original list price (down from 31% in August and 35% in July). In April 2022, that figure was 61%! Ahhh! The good old days!
- 69% of the homes sold in September were on the market less than a month before they found a buyer (down from 72% in August). In April 2022, that figure was 88%.
- 29% of the homes sold in September were all-cash, equalling the January 2023 high.
- 27% of buyers waived the inspection contingency (up from 23% in August). In June 2022, that peaked at 30%. You wouldn’t do that unless you were afraid of losing out to someone else.
Mortgage Market
At the end of August, average 30-yr mortgage rates plunged from 7.50% to 7.08%, and hope was building that a return to 6% rates was in sight. Since then, the 10-year US treasury has moved sharply closer to 5% and mortgage rates have jumped above 8%. And while more Fed members are suggesting that the Fed has already done enough, Mr. Powell hasn’t even come close to declaring “mission accomplished.”
Interestingly, the last time the yield on the 10-year UST was this high (2007), mortgage rates were 100 basis points (1%) lower. What’s different this time? We’ll never know for sure, but it seems to reflect: 1) greater uncertainty with regards to the Fed’s policy rate direction, and 2) the steeply inverted yield curve.
The futures market is currently pricing in a tiny 4% chance of a rate hike on November 1, but is putting a 37% probability on a +25 bps hike at the subsequent FOMC meeting on December 13.
They Said It
“The housing affordability crisis can only be solved by adding additional attainable, affordable supply. Boosting housing production would help reduce the shelter inflation component that was responsible for more than half of the overall Consumer Price Index increase in September and aid the Fed’s mission to bring inflation back down to 2%. However, uncertainty regarding monetary policy is contributing to affordability challenges in the market.” — Robert Dietz, NAHB’s Chief Economist
“As has been the case throughout this year, limited inventory and low housing affordability continue to hamper home sales. The Federal Reserve simply cannot keep raising interest rates in light of softening inflation and weakening job gains.” — Lawrence Yu, NAR’s Chief Economist
 Goodbye Paperwork.
Hello Quick Approval.
Save Your Time & Apply Online. Guaranteed Lowest Rates!
