Mortgage Blog
Let us make this easy for you!
Weekly Update January 12th
January 12, 2024 | Posted by: Paul London
Real Estate News in Brief
With the spring/summer selling season around the corner, there are many reasons to be optimistic. Mortgage rates have already dropped, the Fed is likely to start cutting short-term rates in the next few months, and even home inventory is starting to improve.
Christmas inventory gift. Santa delivered more homes to needy buyers in December 2023. New listings rose 9% year-over-year and active inventory (excluding homes under contract) rose 5% year-over-year. Full disclosure: both new listings and active inventory actually fell month-over-month in December. That happens every year. It’s just that this year, inventory fell a lot less than normal. Is this a sign that ‘locked-in’ homeowners are getting ‘unlocked’ by lower mortgage rates? Let’s hope so!
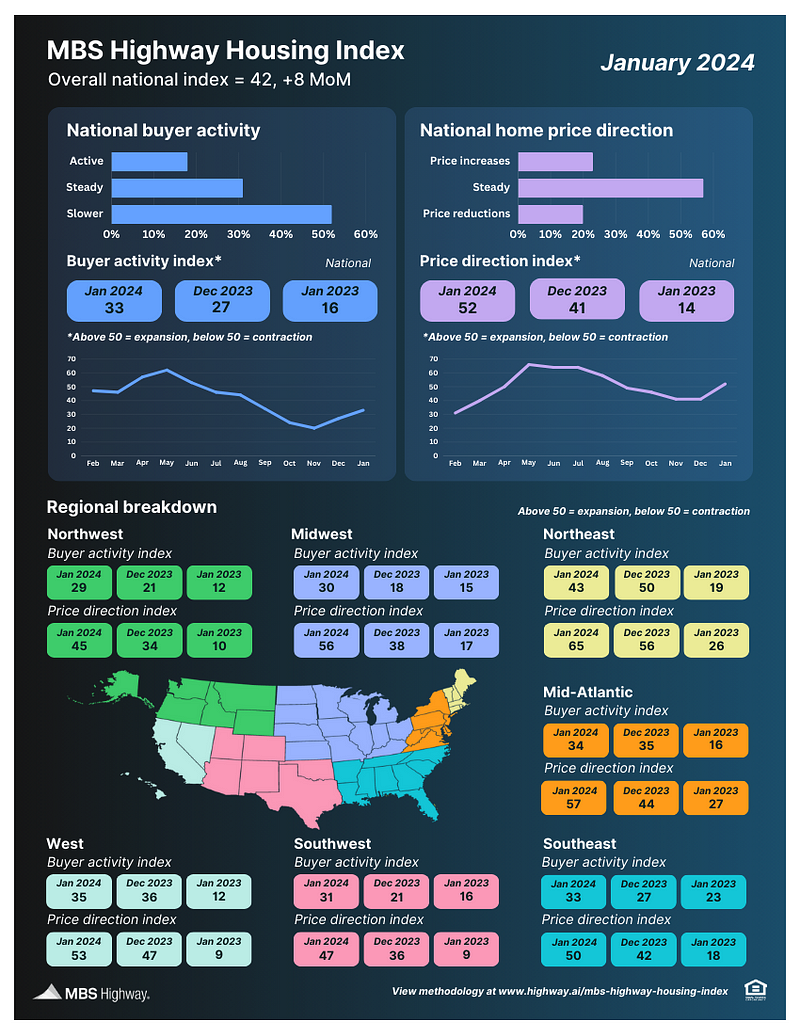
The MBS Highway Housing Index for January 2024 improved for the second-straight month (from 34 → 42), confirming the turnaround that commenced in December 2023. While the Buyer Activity sub-index continued to improve (27 → 33), it was the Price Direction sub-index (41 → 52) that led the way in January 2024, with five out of seven regions posting numbers at or above 50 (indicating net positive price direction). [MBS Highway]
Go east, young family? All 10 of Zillow’s top housing markets for 2024 were cities located east of the Mississippi. Buffalo, NY was #1; Cincinnati, OH was #2. The cities in the graphic below offered the best combination of economic growth and forecast home price appreciation. [Zillow]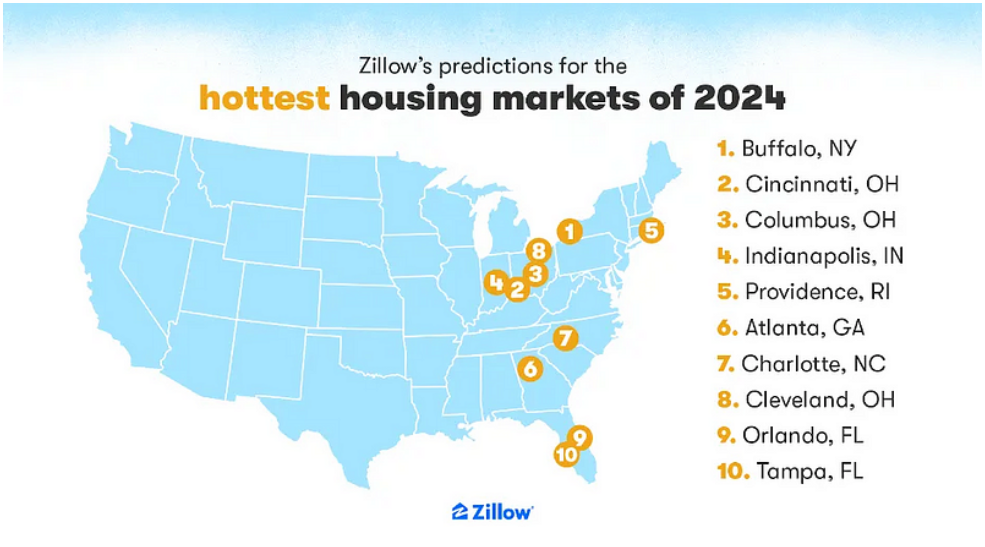 Another record for home prices. CoreLogic’s Home Price Insights for November 2023 showed national home prices up 0.2% month-over-month (and 5.2% year-over-year), setting a new record. Home prices will likely end up increasing nearly 7% YoY for full-year 2023. [CoreLogic]
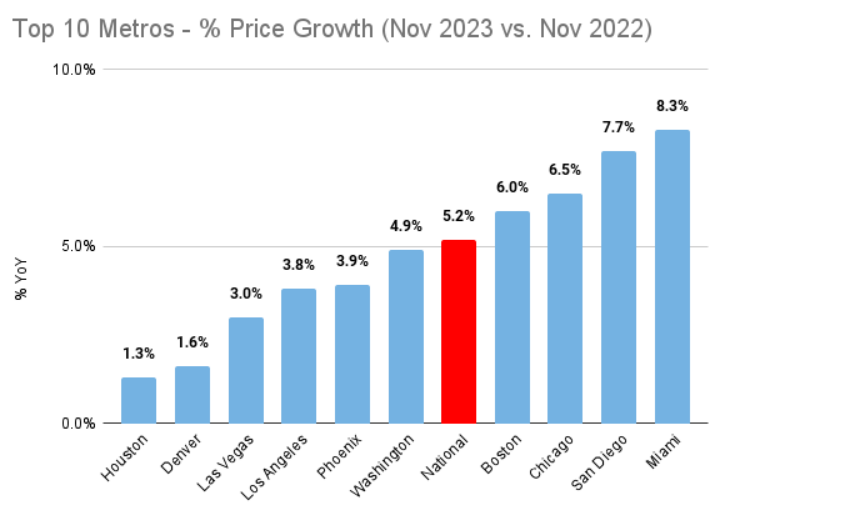
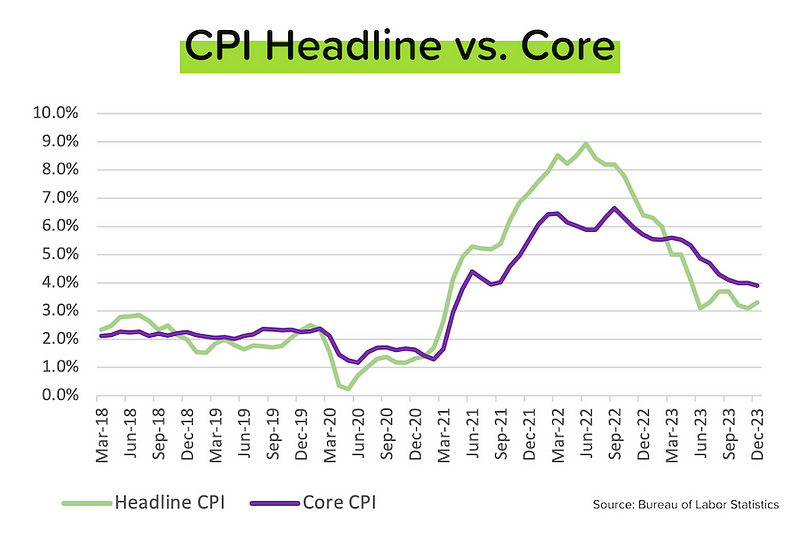
The core inflation trend is our friend. “Headline” CPI rose 0.3% month-over-month in December 2023 — a bit higher than expected. On a year-over-year basis, headline inflation climbed from +3.1% in November 2023 to 3.4% in December 2023. But “core” CPI (which strips out volatile energy & food prices) was +3.9% YoY in December 2023, down slightly from +4.0% YoY in November 2023. Remember: while “headline” inflation is what we all feel, the Fed cares more about “core.” [BLS]
Unlocking Inventory?
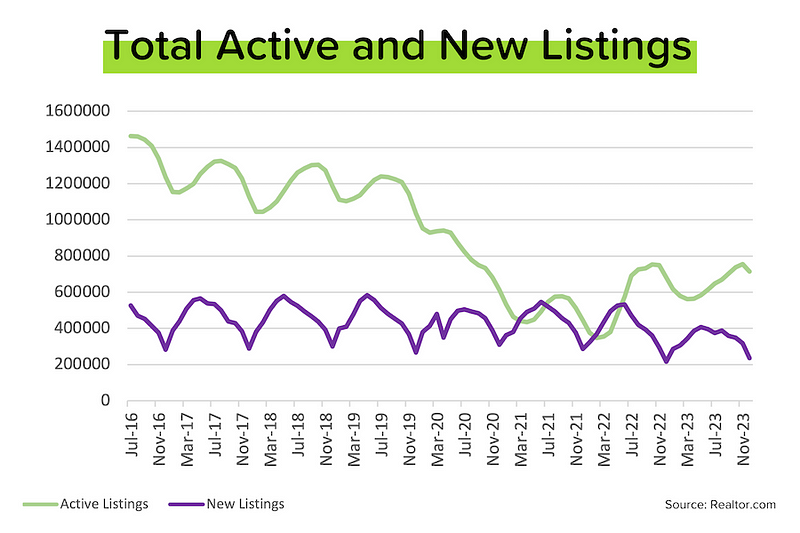
The green line in the graph below is Realtor.com’s active inventory figure (which excludes listings that have already gone under contract). The purple line is new listings. Something very interesting has been happening over the last few months. Can you see it?
Look at new listings. While they always fall in winter, the decline this year has been much less pronounced than it was last year. As a result, new listings were up 9% YoY in December! With mortgage rates down nearly 150 bps (1.5%), are ‘locked-in’ homeowners beginning to feel a bit more comfortable about selling (and then buying a new home)? It would seem so. And remember, with home prices continuing to rise, home equity values are increasing too. In other words, homeowners are sitting on bigger gains.
MBS Highway Housing Survey: Turnaround Confirmed
The recovery that commenced in December 2023 has been confirmed in January 2024, with a stronger-than-seasonal jump in home price trajectory and buyer activity levels. The nearly 150 bps (1.5%) drop in mortgage rates over the last few months of 2023, coupled with slightly higher inventory, has reenergized buyers.
- The MBS Highway National Housing Index jumped to 42 in January 2024, from 34 in December 2023. This was the second-straight month of improvement after six months of decline. In January 2023, the index stood at just 15.
- While normal seasonality is playing a supporting role in the turnaround, the lead actor has been the sharp fall in mortgage rates in late-2023. In December 2023, the Buyer Activity sub-index responded first by jumping 7 points. In January 2024, it was the Home Price Direction sub-index that led the charge, climbing 11 points to 52. This is the first time that the Home Price Direction sub-index has been above 50 (net positive pricing trends) since August 2023. In January 2023, this sub-index was at 14.
- The regional recovery was most notable in the Price Direction sub-indexes, with five out of seven regions now posting numbers at or above 50 (the Northeast region was highest at 65). The largest increases came from the Midwest (38 → 56) and Mid-Atlantic (44 → 57) regions.
- Many regions (especially the Midwest, Southwest and Northwest) saw further month-over-month improvements in their Buyer Activity sub-indexes. That said, winter’s grip and low inventory levels kept activity levels relatively subdued. It’s worth remembering, however, that activity levels in January 2024 are significantly higher than they were in January 2023.
Mortgage Market
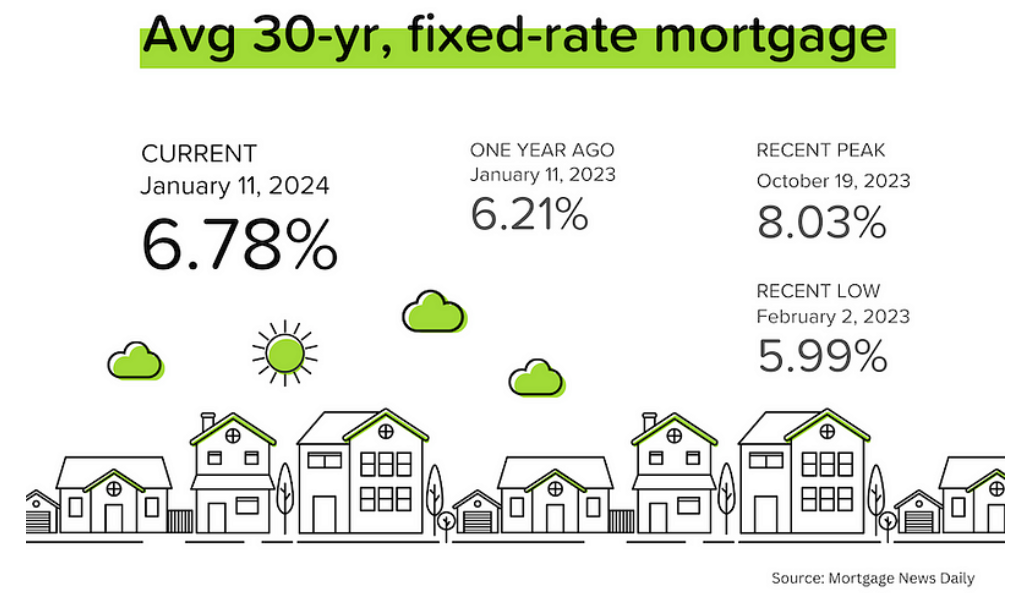
It’s actually surprising how well the bond market has behaved, largely shrugging off a stronger-than-expected BLS jobs figure AND the bump up in headline CPI. Average 30-yr fixed-rate mortgage rates moved up last week, but not a lot. The debate is WHEN, not IF, the Fed starts cutting rates.
The next Fed rate decision will be on January 31. The Fed Funds futures market is currently pricing in a 97% probability that the Fed will do nothing (no hike, no cut). But for the subsequent meeting on March 20, the probability of a 25 bps cut (0.25% or one-quarter of 1%) is now 67%.
 Goodbye Paperwork.
Hello Quick Approval.
Save Your Time & Apply Online. Guaranteed Lowest Rates!
